Blog

us.jpg   fr.jpg

Comparaison des performances boursieres par pays depuis 1969

Picture93.png

Narrow Leadership Performance

Picture92.png

Market leadership remains extremely narrow since 1990

Picture91.png

BofA private client equity holdings as % of AUM since 2005

Picture90.png

MSCI US P/E relative to MSO WorldxUS P/E since 1970

Picture89.png

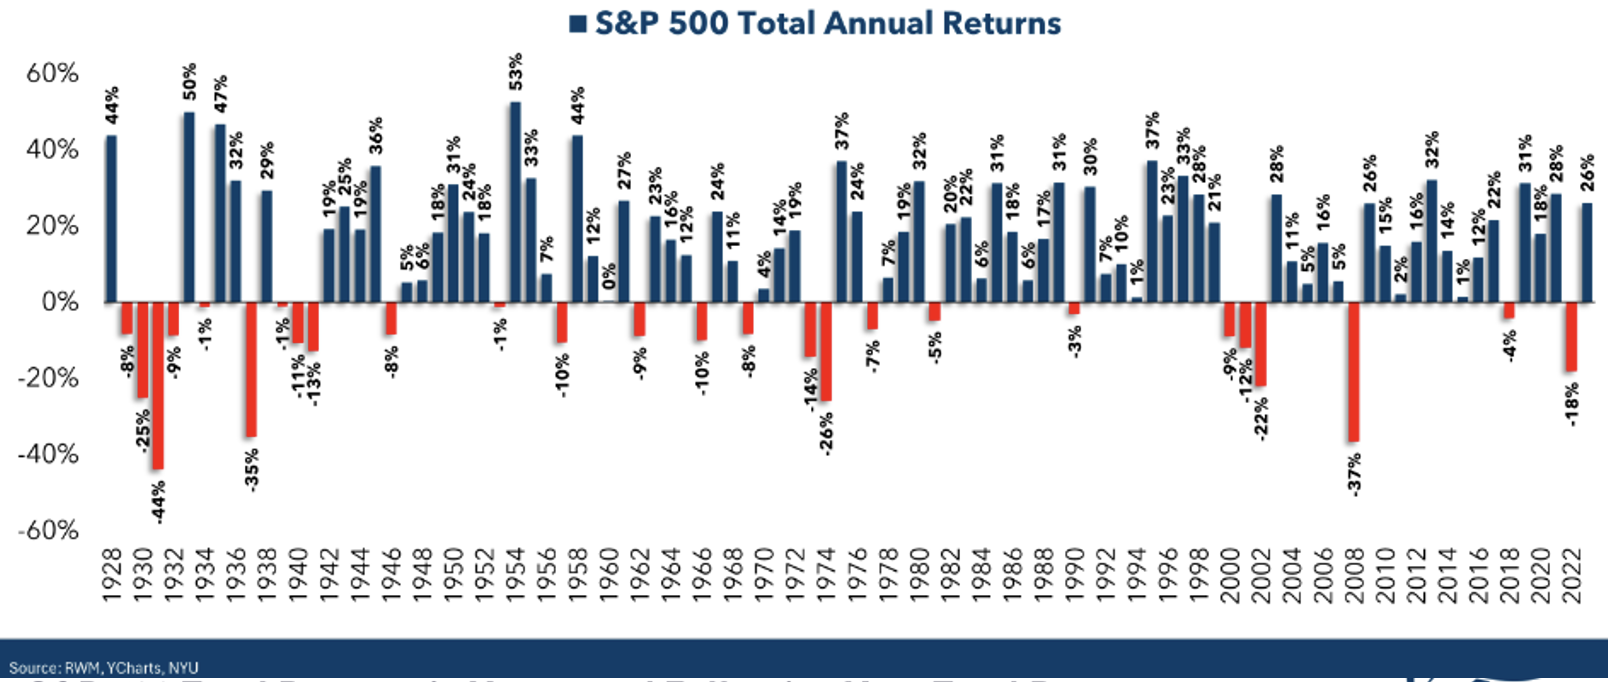
S&P 500 Intra-Year Decline

Picture88.png

Current discount to NAV is below historical average of 1.3% premium

Picture87.png

Relative valuations of small caps are near twenty-year lows

Picture86.png

Stocks and Bonds Created Significantly More Wealth Than Cash Over Most Decades

Picture85.png

Inflation and Taxes Have Had a Significantly Negative Effect on CD Returns Since 2004

Picture84.png

Syndicate content