Blog

us.jpg   fr.jpg

Percent of countries with inverted yield curves since 1995

18.png

10-year rate vs. 10-year rate forecasts from Fed's survey of professional forecasters since 2003

17.png

Annualized returns over different time frames of long bonds, 5-year treasuries, and 1-month T-bills

16.png

Vanguard 10-year outlook annualized returns

15.png

Interest rate regimes: 1926-2022

14.png

Real annualized returns (%) on equities versus bonds and bills internationally, 1900-2022

13.png

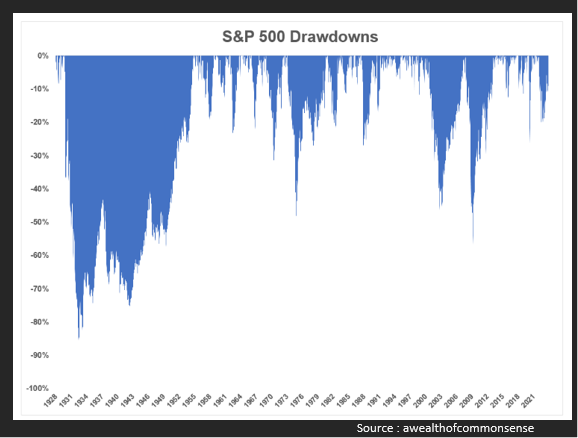
S&P 500 index peak-to-trough performance from all time highs

12.png

US median housing payment as % of median income since 2006

11.png

Percentage of large-cap domestic equity funds underperforming the S&P 500 each year since 2001

9.png

S&P 500: Number of all-time highs (1929-2023)

7.png

Syndicate content