Blog

us.jpg   fr.jpg

US yields among highest in developed world

740.png

S&P 500 performance in post-WW2 bull markets (%): First 435 trading days

739.png

Historic SPX bear runs

736.png

Headline global real rates, GDP weighted, and trend declines: 1314-2018

735.png

MSCI EM to S&P 500 ratio vs. USD broad trade weighted index since 1996

734.png

S&P 500 index / MSCI emerging markets index since 1991

733.png

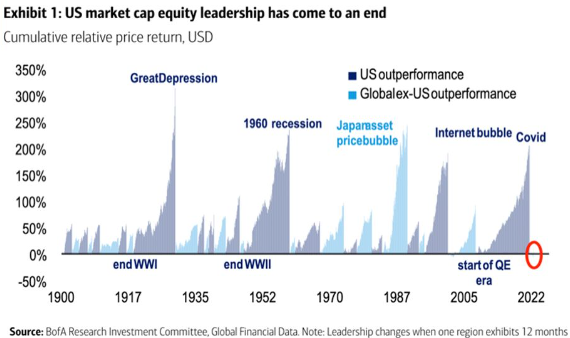
MSCI USA price return USD index/ MSCI world excluding United states index since 1970

732.png

S&P 500 value vs. growth: Relative total return

731.png

USD and current account and budget balance since 1971

730.png

US existing home sales months supply NSA since 2000

728.png

Syndicate content