Blog

us.jpg   fr.jpg

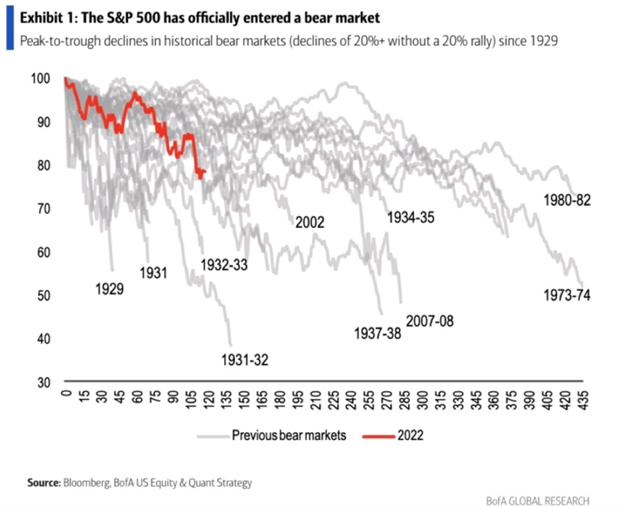
Days in bear market since 1966

208.png

30 year mortgage rate since 1970

207.png

Value spread for hypothetical global value portfolio 1990-2022

206.png

Earnings explained nearly 50% of market returns pre-GFC, but only 23% of post-GFC returns

203.png

S&P 500 growth index divided by S&P 500 value since 1975

201.png

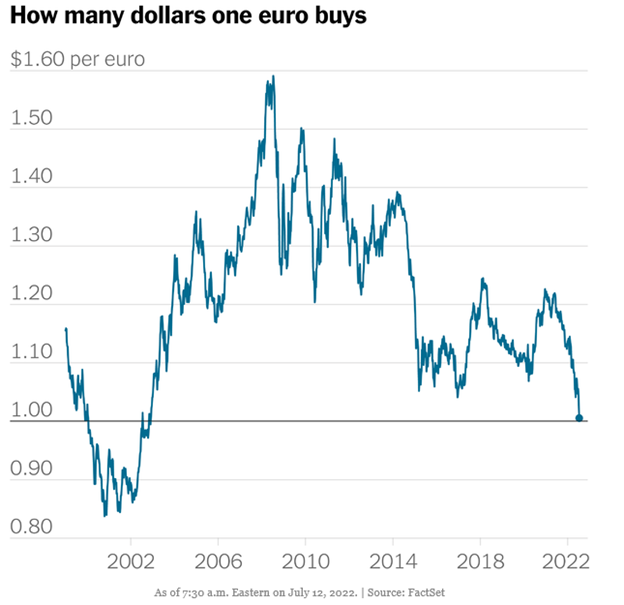
EURUSD cross: Since 2000

200.png

Annualized nominal returns and standard deviation 1973 - Q2 2022

198.png

Ratio of real assets blend vs. global equities (December 1972-June 2022)

197.png

Various valuation scores of different sectors vs. global equities

196.png

Growth of $1 over the next 20 years since 1990

194.png

Syndicate content