Blog

us.jpg   fr.jpg

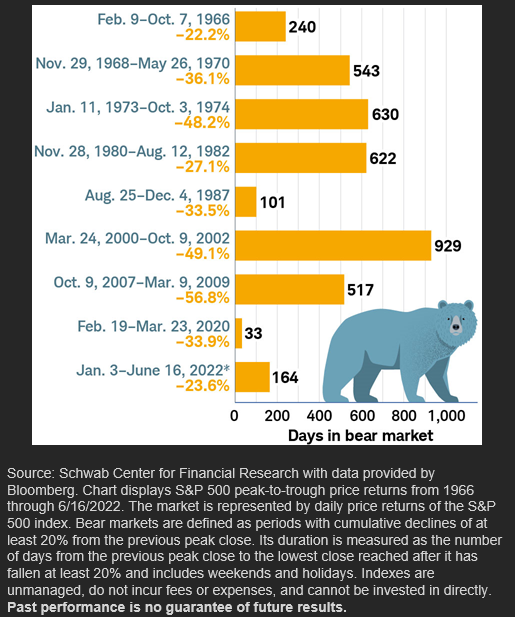
Bull and bear markets returns and duration since 1926

61.png

World composite CPI, y/y percent change since 1998

60.png

US stocks vs. bond returns 1926-2022

59.png

10-year yields calendar year change (bps) since 1966

58.png

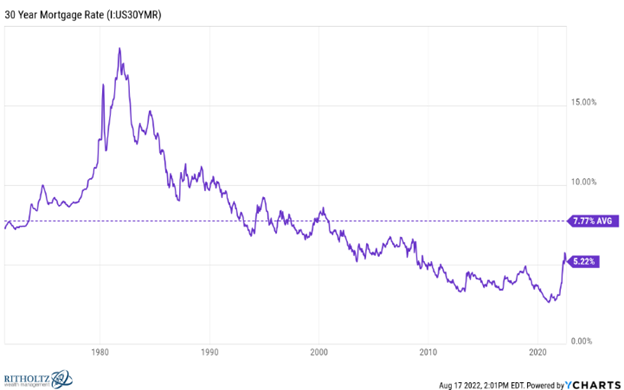
Annual mortgage cost as a percentage of household income since 1947

57.png

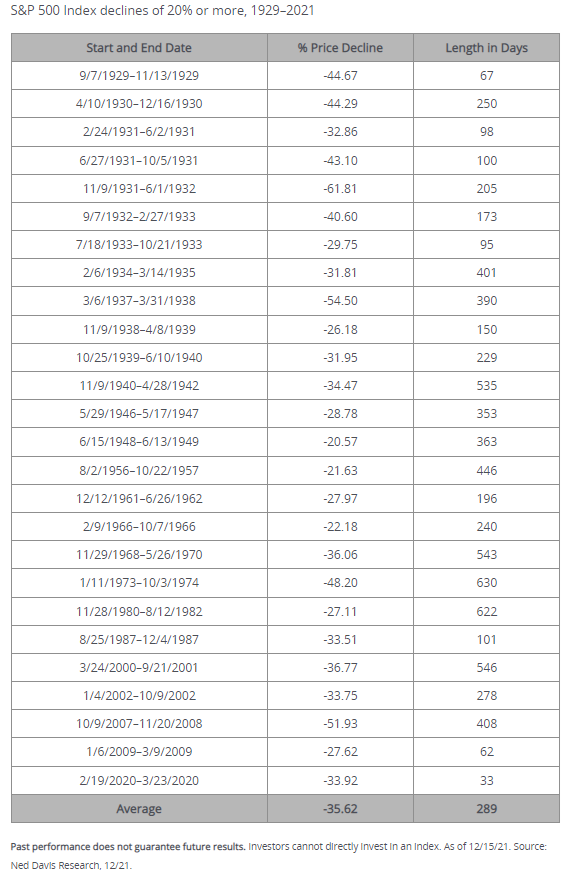
When the S&P 500 is down 25% or worse since 1950

56.png

S&P 500 annualized returns and the growth of $10,000 over 20 years (2001-2021)

55.png

JP Morgan real broad effective exchange rate index, CPI based: US (since 1970)

53.png

US equity relative performance & US trade weighted nominal dollar since 1990

52.png

S&P 500 index (logarithmic scale) since 1957

51.png

Syndicate content