Blog

us.jpg   fr.jpg

Intermediate term bonds pay off over the longer run (2001-2023)

image106.png

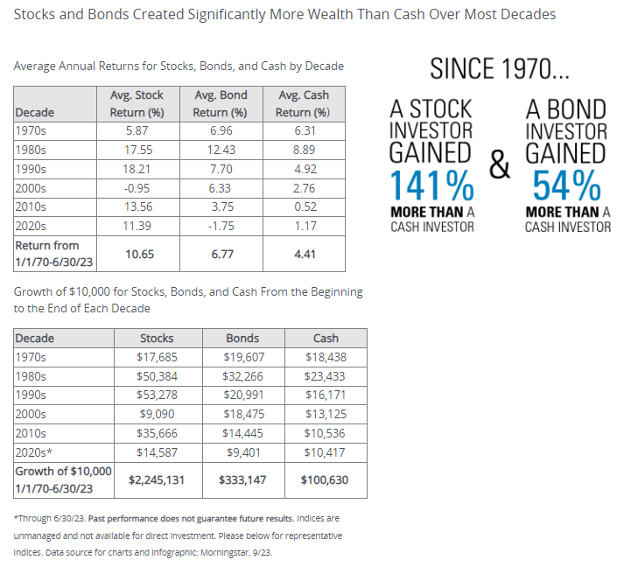
Average underperformance: cash vs. stocks

image105.png

CEO business confidence expections for economy (6 months ahead) compared to S&P 500 Index since 1985

image104.png

3-month treasury bill yield since 1928

image103.png

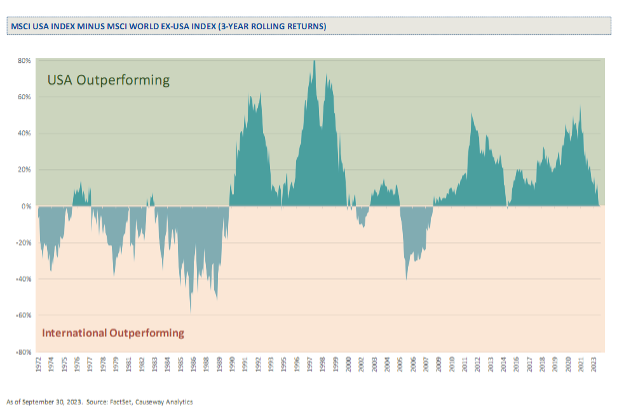
Annualized returns during the best times for international stocks since 1971

image102.png

US home mortage 30-year fixed national average vs. US effective rate of interest on mortgage debt outstanding since 1980

image101.png

More new apartments under construction today than any time in the past 50 years

image100.png

Nominal home prices by country since 1996

image099.png

US nominal house price index since 1890

image098.png

S&P 500 bear markets since WWII

image097.png

Syndicate content