Blog

us.jpg   fr.jpg

Yields across fixed income asset classes

image096.png

EPS growth vs P/E

image095.png

Core CPI and unemployment rate when fed starts rate cuts since 1955

image094.png

Blended U.S. money supply (year-on-year % change) since 1831

image093.png

Blended U.S. money supply (year-on-year % change) since 1831

image093.png

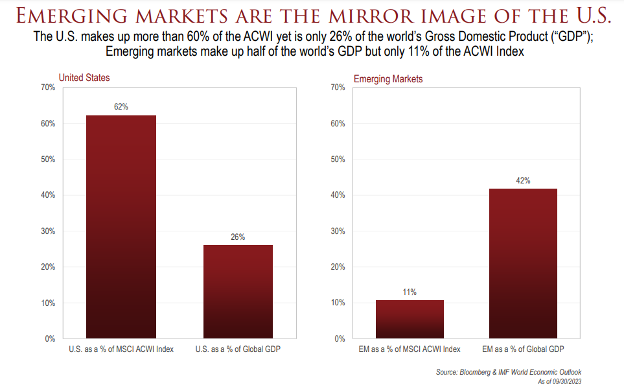
What’s next for emerging markets?

image092.png

Calendar-based rebalancing methods

image090.png

S&P 500 worst years since 1930

image088.png

S&P bear markets vs bull markets since 1929

image087.png

The Dow Jones Industrial Average: 1914-1939

image086.png

Syndicate content