Blog

us.jpg   fr.jpg

Ten-year US treasury since 1962

574.png

Two-year US treasury since 1977

573.png

Performance of "disinflation/deflation assets" vs. "inflation assets" since 1960

571.png

Guggenheim recession probability forecast since 1970

570.png

REIT dividend yield vs. 10yr treasury yield

569.png

Price-to-NAV since 1990

568.png

Quarterly US 10-year treasury total return series - Q1'22 one of the worst quarters on record

567.png

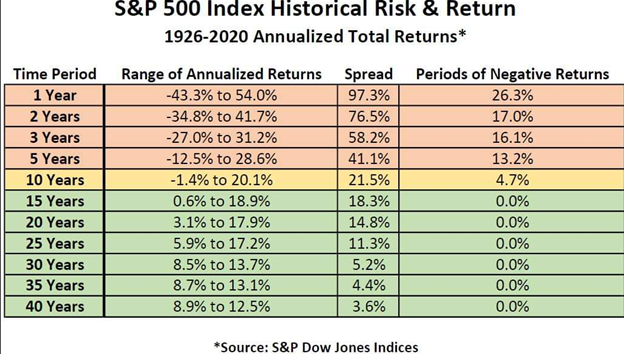
S&P 500 annualized returns and the growth of $10,000 over 20 years (2001-2021)

566.png

Worst bond performance since Q3 1980

565.png

S&P 500 index max putback per calendar year since 1980

564.png

Syndicate content