Blog

us.jpg   fr.jpg

S&P 500 performance and key market events since 1950

542.png

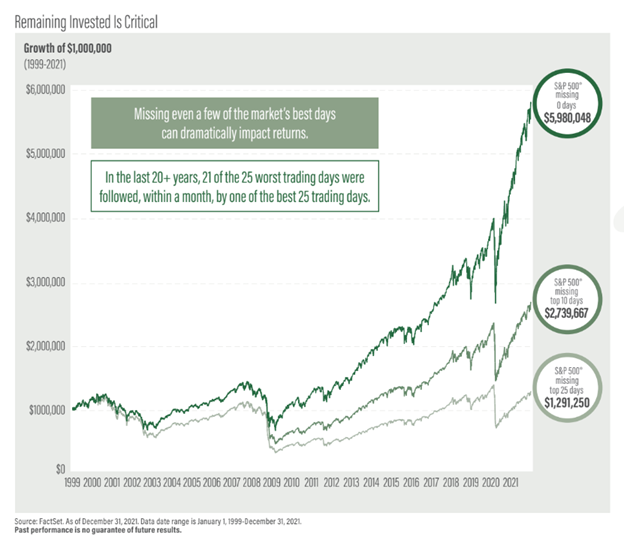
Growth of $1,000,000 since 1999

541.png

Ratio of real assets blend vs. global equities since 1991

538.png

Real assets are trading near 20-year lows relative to stocks

537.png

Bloomberg Barclays aggregate, total return (1977-2022)

535.png

Morningstar style box YTD performance

534.png

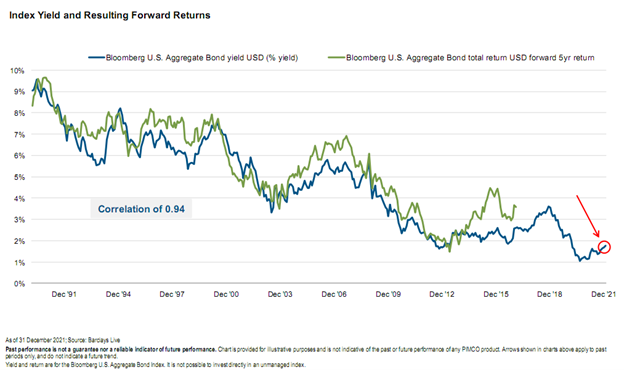
Bloomberg US aggregate bond index since 1990

533.png

Distribution of five-year wealth amounts from investing $100 today in the S&P 500

530.png

S&P 500 with & without its best & worst days since 1991

529.png

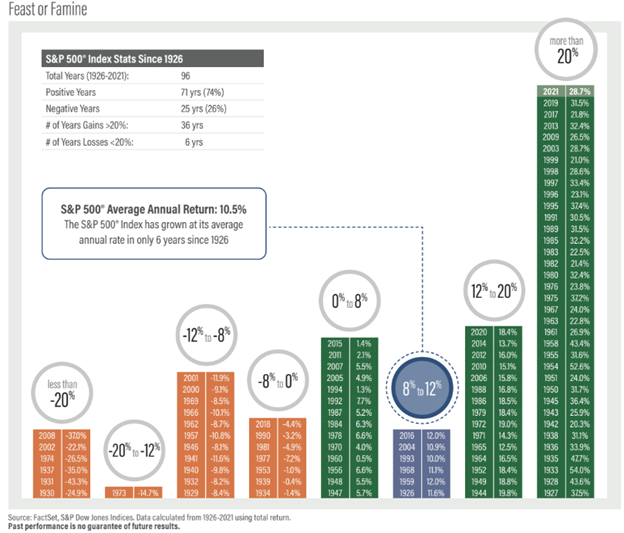
S&P 500 calendar year returns since 1951

527.png

Syndicate content