Blog

us.jpg   fr.jpg

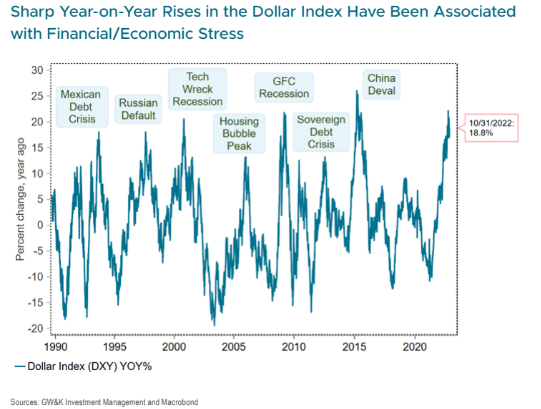
US dollar bull and bear cycles since 1970

Picture217.png

Income is back in fixed income

Picture215.png

US 10-year treasury yield (%) since 1955

Picture214.png

Index cumulative return since 1990

Picture213.jpg.png

Distribution of historical stock and bond returns since 1873

Picture213.jpg

Barclays BTOP50 vs. MSCI world index

Picture212.png

10-Year US treasury drawdown since 1950

Picture211.png

'Safe' bonds (10 year treasuries) yearly returns (%) since 1928

Picture210.png

Bond performance after FED pauses since 1984

Picture209.png

Syndicate content