Blog

us.jpg   fr.jpg

Two more recent examples where stock performance was disappointing over a thirty-year interval

Picture68.png

Nominal total return and deflated price return on US stocks since 1929

Picture67.png

Annual mortgage cost as a percentage of household income since 1948

Picture66.png

EM real yields minus DM real yields (%) since 2007

Picture65.png

S&P CoreLogic Case-Shiller US national home price index since 1987

Picture64.png

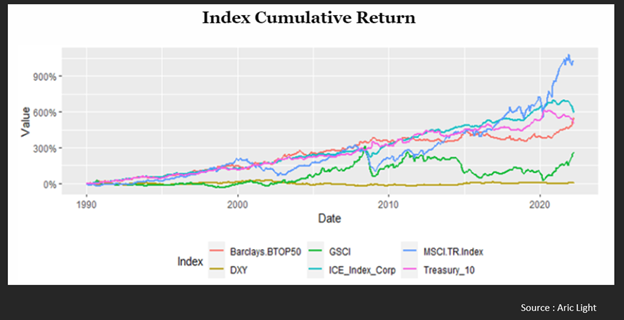
S&P 500, US 10-year treasury, and 60/40 portfolio total returns since 1928

Picture63.png

Breakdown of all publicly traded firms with market capitalizations that exceed zero traded anywhere in the world

Picture62.png

Experts' 10-year forecasts for long-term asset-class returns

Picture61.png

Periods of negative or low real returns on equities and of negative equity premia since 1900

Picture60.png

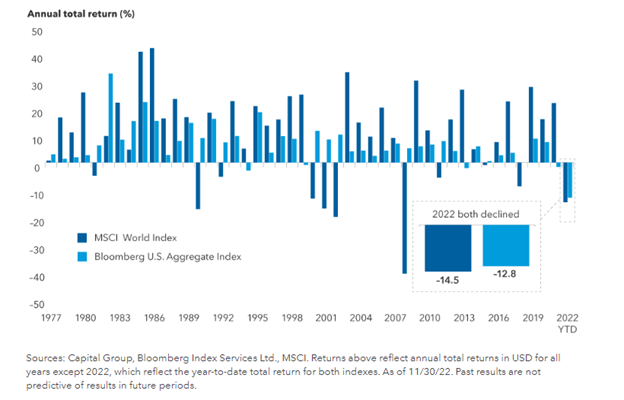
BBG aggregate index, BBG US credit index, and S&P 500 index all suffered major drawdowns in 2022

Picture59.png

Syndicate content